Docker is a powerful tool that allows you to easily deploy and manage applications in a containerized environment. If you’re also a user of NordVPN, you may wish to pass the traffic coming from your…
Evaluating Backend Options For Prometheus Metrics
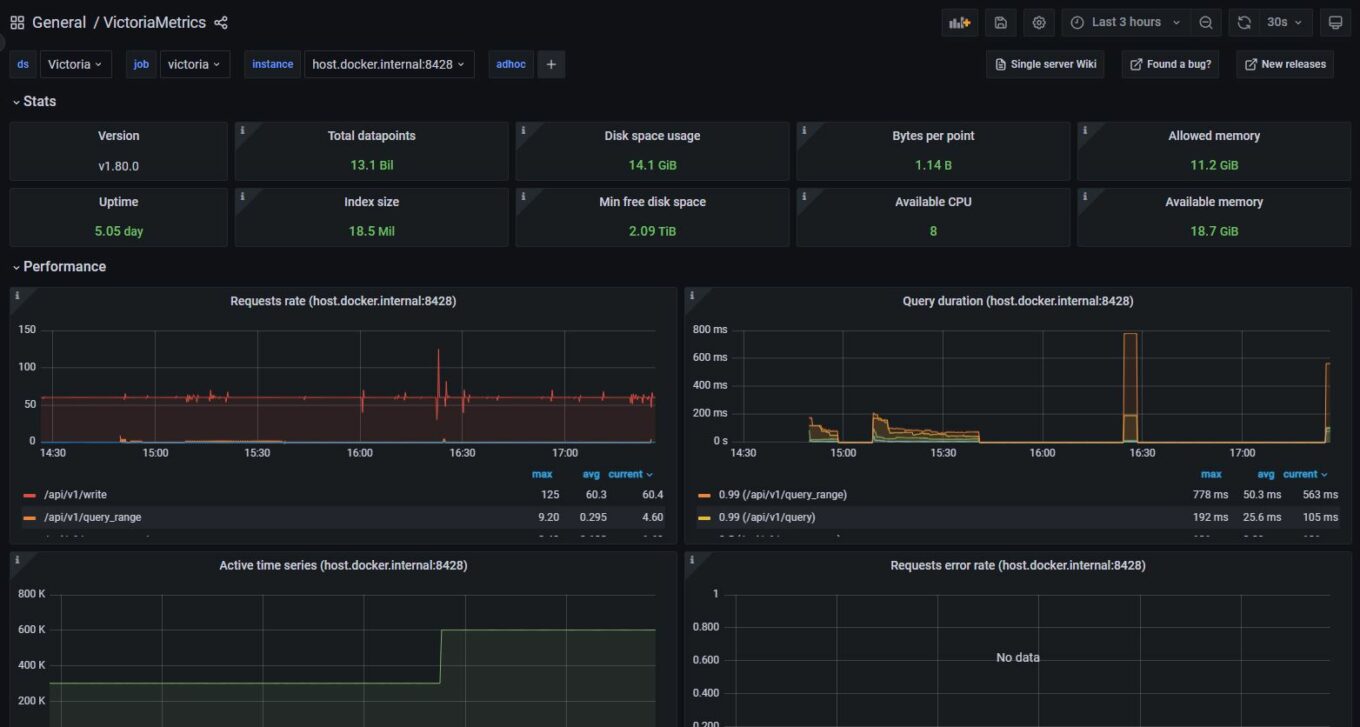
I’ve recently been looking at consolidating metrics from multiple Prometheus servers into one horizontally scalable central store. There’s plenty of open source options out there, with the most notable being Thanos, Cortex (now Mimir), Victoria…
Live Utility Meter Monitoring With Grafana & Software Defined Radio
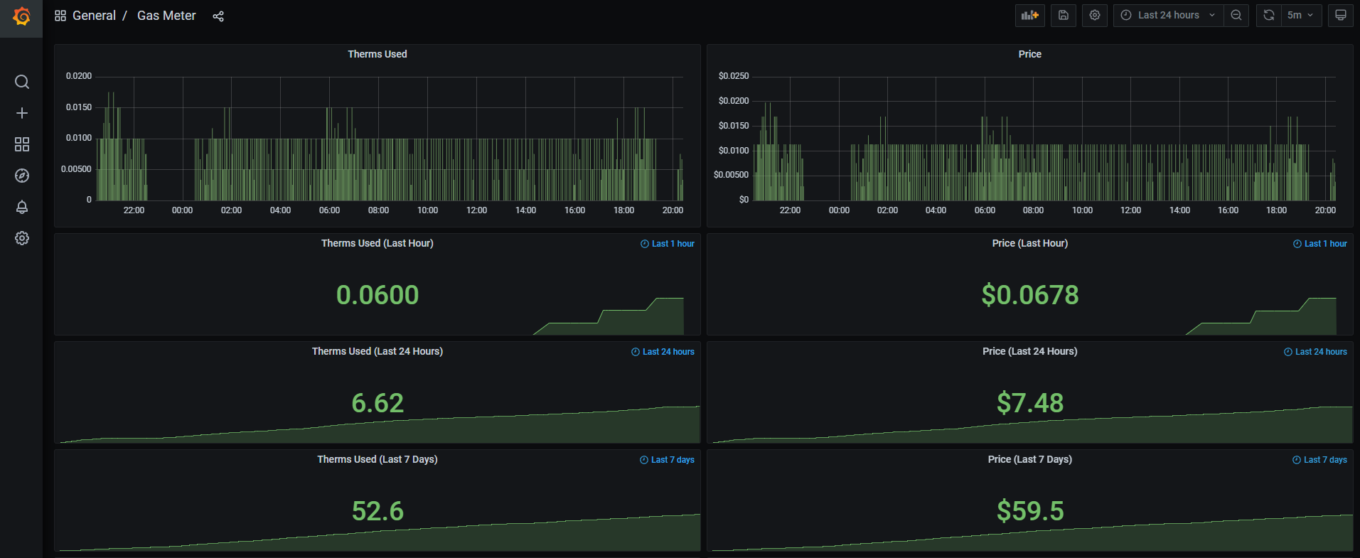
Ever wondered what your utility bill was going to be before you got it? Or wanted to see your utility usage live? Well you’re in luck, because most utility meters nowadays typically transmit this data…
InfluxDB V2: Using The V1 API For V1 Dependent Applications
With the expanded feature set that InfluxDB V2 offers, many want to upgrade their existing V1 InfluxDB installations. The issue is that there are a lot of incompatibilities between V1 and V2. Any of your…
What Can The Telegraf Agent Do?
Well when it comes to monitoring, it covers all the basics you’ll probably ever encounter. For those who don’t know, the Telegraf agent is a monitoring agent that can be installed on servers (or any…


