The lack of functionality to do deadman checks is one of my biggest gripes with PromQL. Fortunately, MetricsQL (a superset of PromQL) has added this functionality, and it’s very easy to use. If you’re not…
Tag: Grafana
Setting Up A Grafana Loki Demo Environment on Kubernetes

I recently wanted to set up a small Loki environment on Kubernetes just to see how it worked, evaluate how it performs out of the box, and decide if it was something I wanted to…
Evaluating Backend Options For Prometheus Metrics
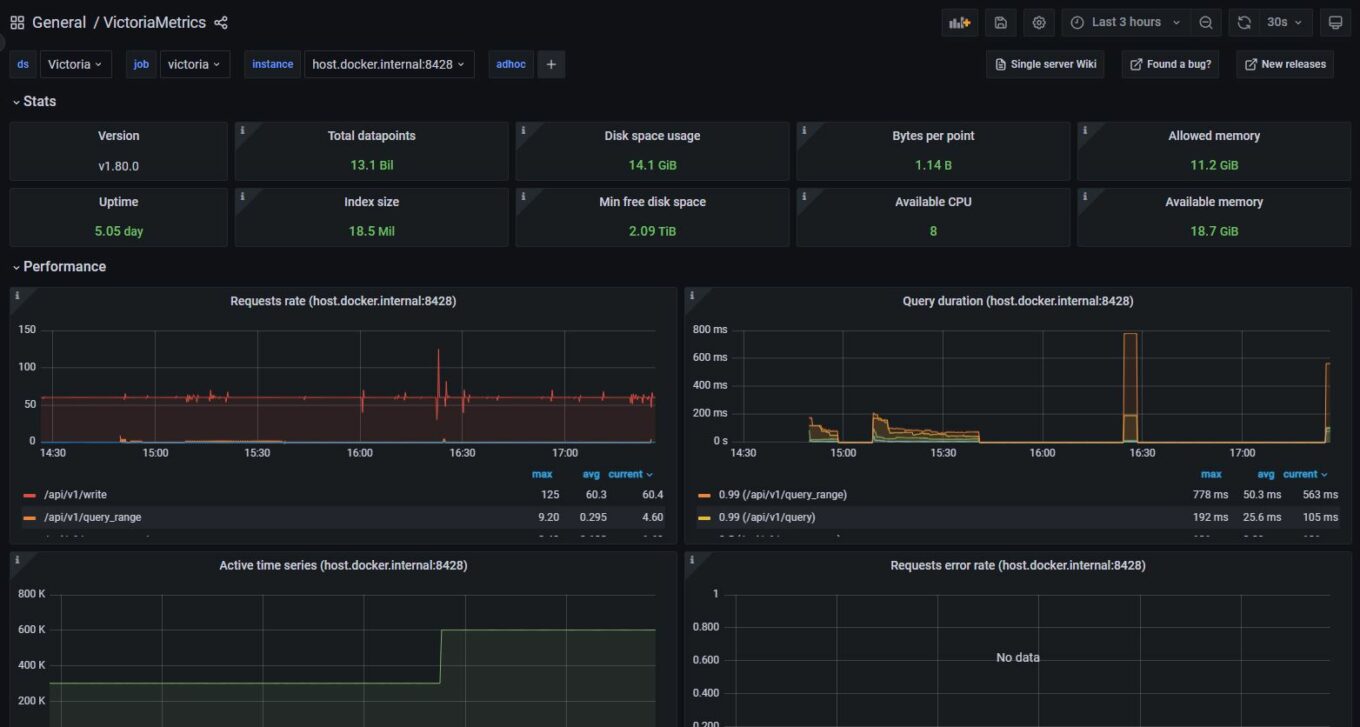
I’ve recently been looking at consolidating metrics from multiple Prometheus servers into one horizontally scalable central store. There’s plenty of open source options out there, with the most notable being Thanos, Cortex (now Mimir), Victoria…